
AI-based attendance forecast for tourist attractions
Our AI models analyze dozens of variables that humans cannot effectively process to accurately predict the number of visitors to your attraction on a given day.

Can you afford to be unpredictable?
.png)
Cost Optimization
Reduce unnecessary staffing costs on low-volume days. Plan your schedules more efficiently.
Minimize losses due to food spoilage: Knowing that 40% fewer guests will arrive tomorrow, you defrost, order, and prepare fewer products with short expiration dates.
On days with a low forecast, schedule maintenance and turn off parts of lighting, air conditioning, and ventilation systems, generating measurable savings on bills.
Guest Satisfaction
Instead of reacting, plan!
On peak days, open more stalls, increase parking, and deploy additional staff on-site for crowd management. Knowing the expected attendance in advance is a powerful tool in customer service.
With this knowledge, you can effectively communicate with your guests before they even arrive at the attraction. For example, you can proactively recommend optimal arrival times or provide helpful tips on the best parking options—all of which minimizes frustration and significantly increases guest satisfaction.
.png)
.png)
Help in deciding when to launch promotions and marketing campaigns
Know when you have "empty flights" and launch targeted, short-term promotions and campaigns to fill them.
As a result, marketing will cease to be an art of guesswork and become a precise tool of demand engineering.
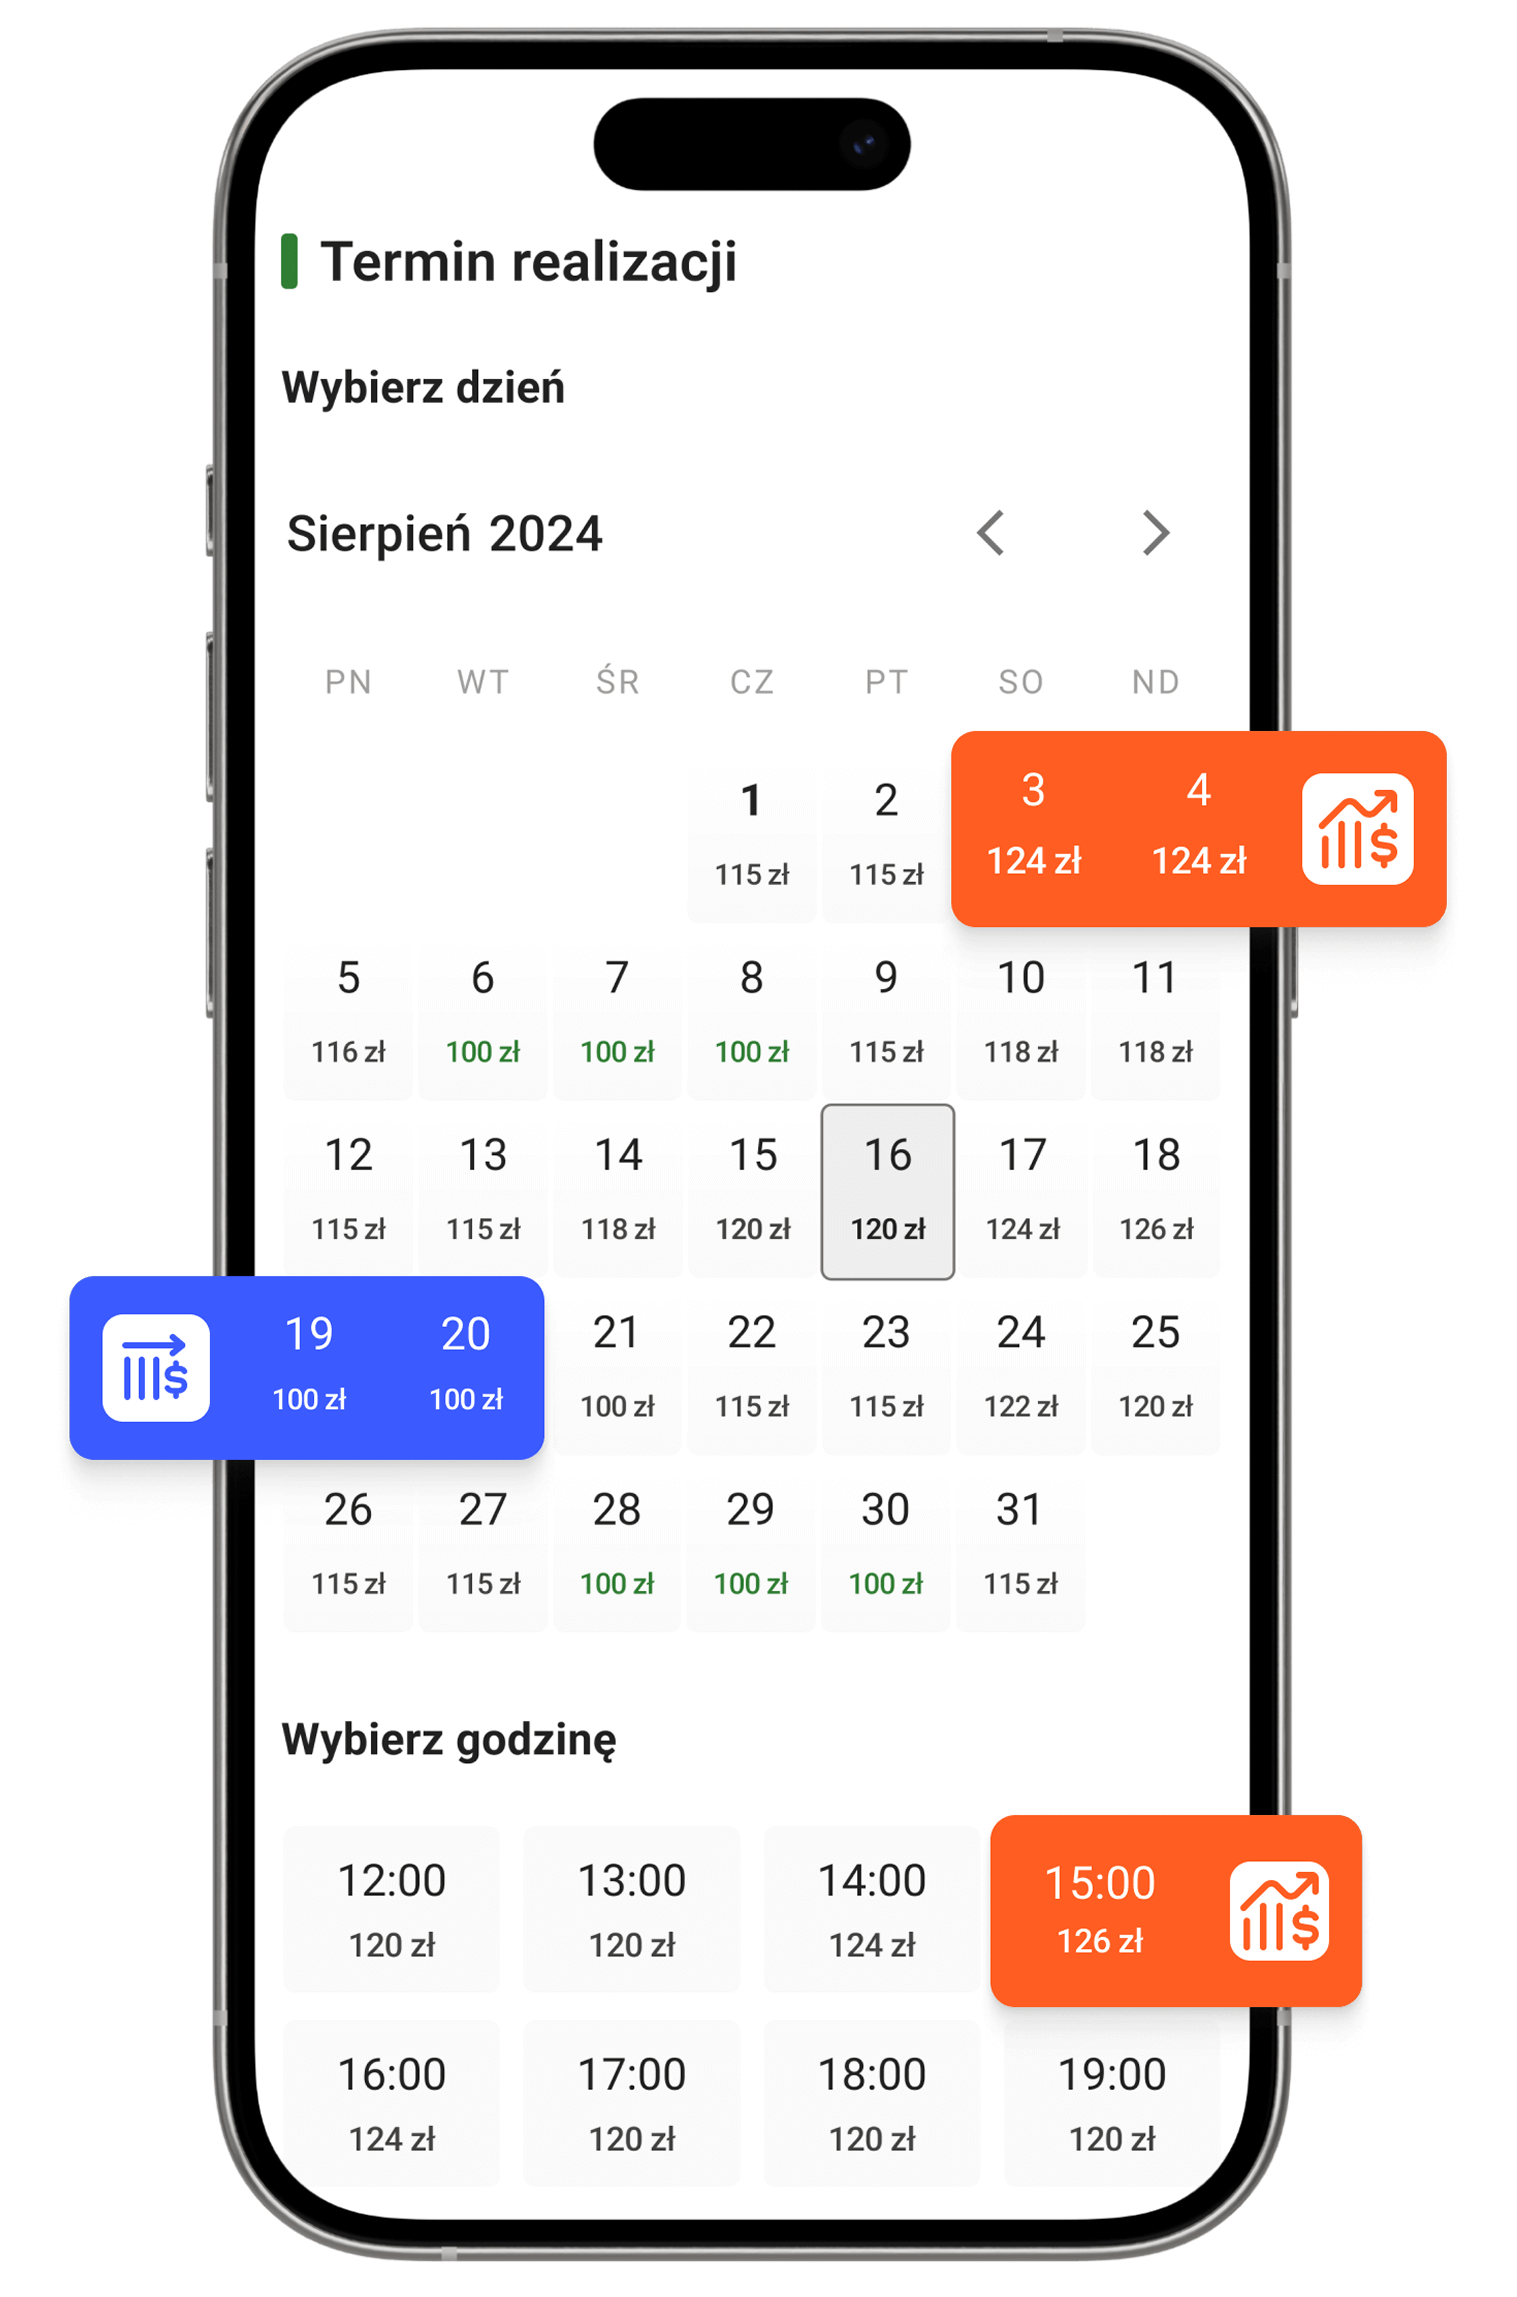
Droplabs Dynamic Pricing
Droplabs is a solution that goes far beyond just attendance forecasting.
Our proprietary AI solutions also form the foundation of an effective online ticketing system with Dynamic Pricing.
As a result, you gain a single tool that provides predictions, makes pricing decisions—always within the ranges you specify and only when you want—and seamlessly processes transactions.
How does it work?
.png)
Rain? Of course there won't be any people!
You're right. There are a dozen or so "obvious" days in every season—no one needs AI to predict full amusement parks on August 15th or empty seats on a rainy Monday in June.
The real challenge is the "non-obvious majority."You've surely experienced a bad weekend when "everything" pointed to success, or been surprised by a great weekday during a vacation. It's these hundreds of "non-obvious" days that hide huge losses or untapped profit potential.
Our artificial intelligence was created precisely to deal with this gray area. AI analyzes a complex and variable mix of factors, detecting subtle relationships that elude intuition or simple statistical models. Thanks to this, you finally have an accurate forecast when you need it most—for every day of the season.Effective attendance forecasting requires understanding that the importance of individual factors is constantly changing and may vary from season to season or from year to year.
On what basis do we predict?
The attendance forecast is generated based on proprietary predictive models using artificial intelligence (AI). We consider various factors, including weather forecasts, historical sales trends, and aggregated customer behavior in the online store.
.png)
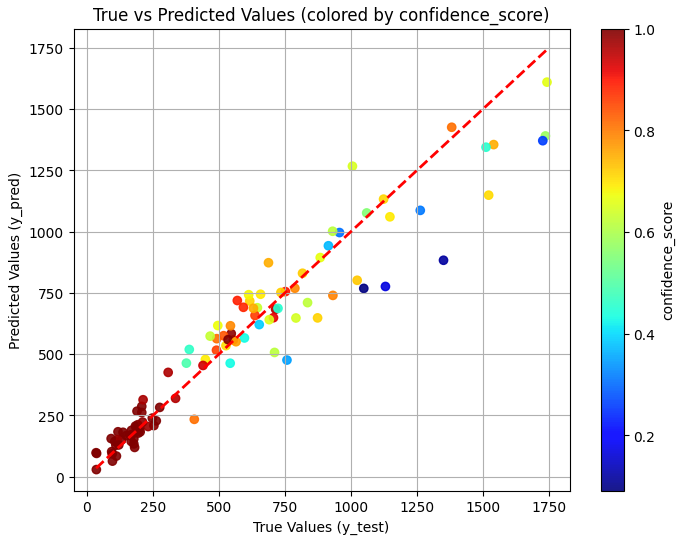
Memory Trap vs. Data Precision
The human mind tends to remember specific or surprising situations, often assigning them unjustified weight.This creates the trap of subjective patterns.
Droplabs' machine learning (AI) allows us to transcend these patterns.The system doesn't "remember" emotions—instead, it analyzes real, massive data sets in a multidimensional context.
This allows it to identify subtle relationships and patterns that facilitate more accurate voter turnout predictions because they transcend conventional thinking and intuitive simplifications.
zdj. https://www.researchgate.net/figure/Deep-neural-network-designed-in-python_fig3_368751902
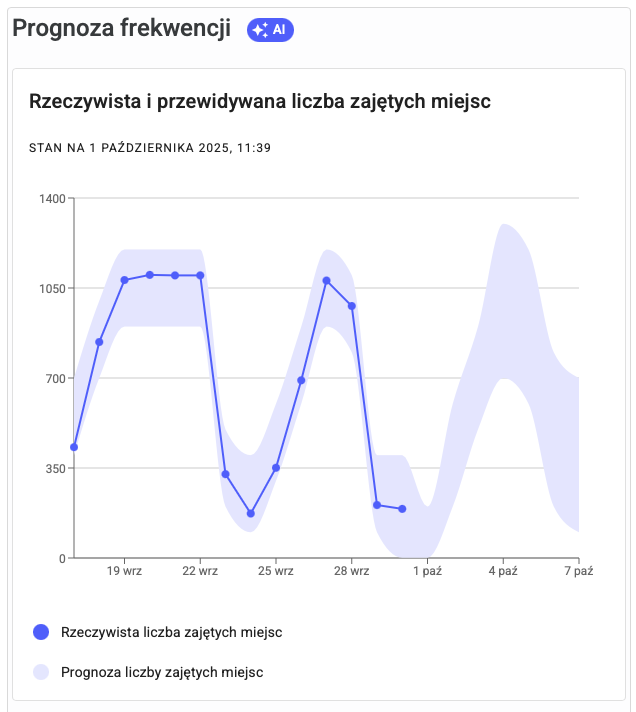
What does it look like in practice?
Droplabs' intuitive dashboard provides instant insight into the future. AI algorithms provide predicted attendance ranges (minimum and maximum) you can expect on a given day—this range is clearly marked by a purple zone on the chart.
Crucially, you can verify the system's historical accuracy: Blue dots: Represent actual visitor numbers.
This allows you to always see how well the system predicted attendance, building confidence in your decisions.
Explore all the possibilities of the system Droplabs
Do you have any questions? Write to us at sprzedaz@droplabs.pl — let's talk!