AI-Based Attendance Prediction

This post is part of a larger article.”AI at the service of heritage: Dynamic Pricing Droplabs and attendance prediction in shaping sustainable tourism behaviour in TPN.”
At first glance, the question of attendance at the Palenica Białczańska car park seems ridiculously simple. A perfectly sunny weekend or a national holiday? You can bet blindly — the parking lot will crack at the seams! All-day downpour and fog on an autumn weekday? That's right, it will be empty. Predicting occupancy on those dozen or so extreme “black and white” days of the year is no art when extreme weather and obvious calendar features overlap.
The art of prediction, however, is not to determine occupancy in these few, easily identifiable days. The real challenge begins with the “non-obvious” days that make up the majority of the calendar: how to predict occupancy when only partial cloud is predicted at the weekend? What determines the attendance if on a holiday day the total rainfall is a little above zero, or when the maximum temperature drops below 20 degrees Celsius? Added to this are the non-holiday weekdays, of which there are the most during the year.
To better illustrate this challenge, let us analyze the scatter plot illustrating the attendance at the parking lot in Palenica Białczańska in relation to the total daily rainfall. The maximum occupancy of the car park is about 1300 cars.

Each dot represents one day a year, and its distribution immediately refutes simple intuitions. On days when there was no precipitation, attendance was recorded from close to zero, up to maximum. These terms represent dots on an axis passing through 0 mm of the total daily precipitation. Likewise, there are many days with a total of rainfall of up to 10 mm, for which the attendance is very high. Large dispersions of attendance are also observed on days with an even greater amount of daily precipitation.
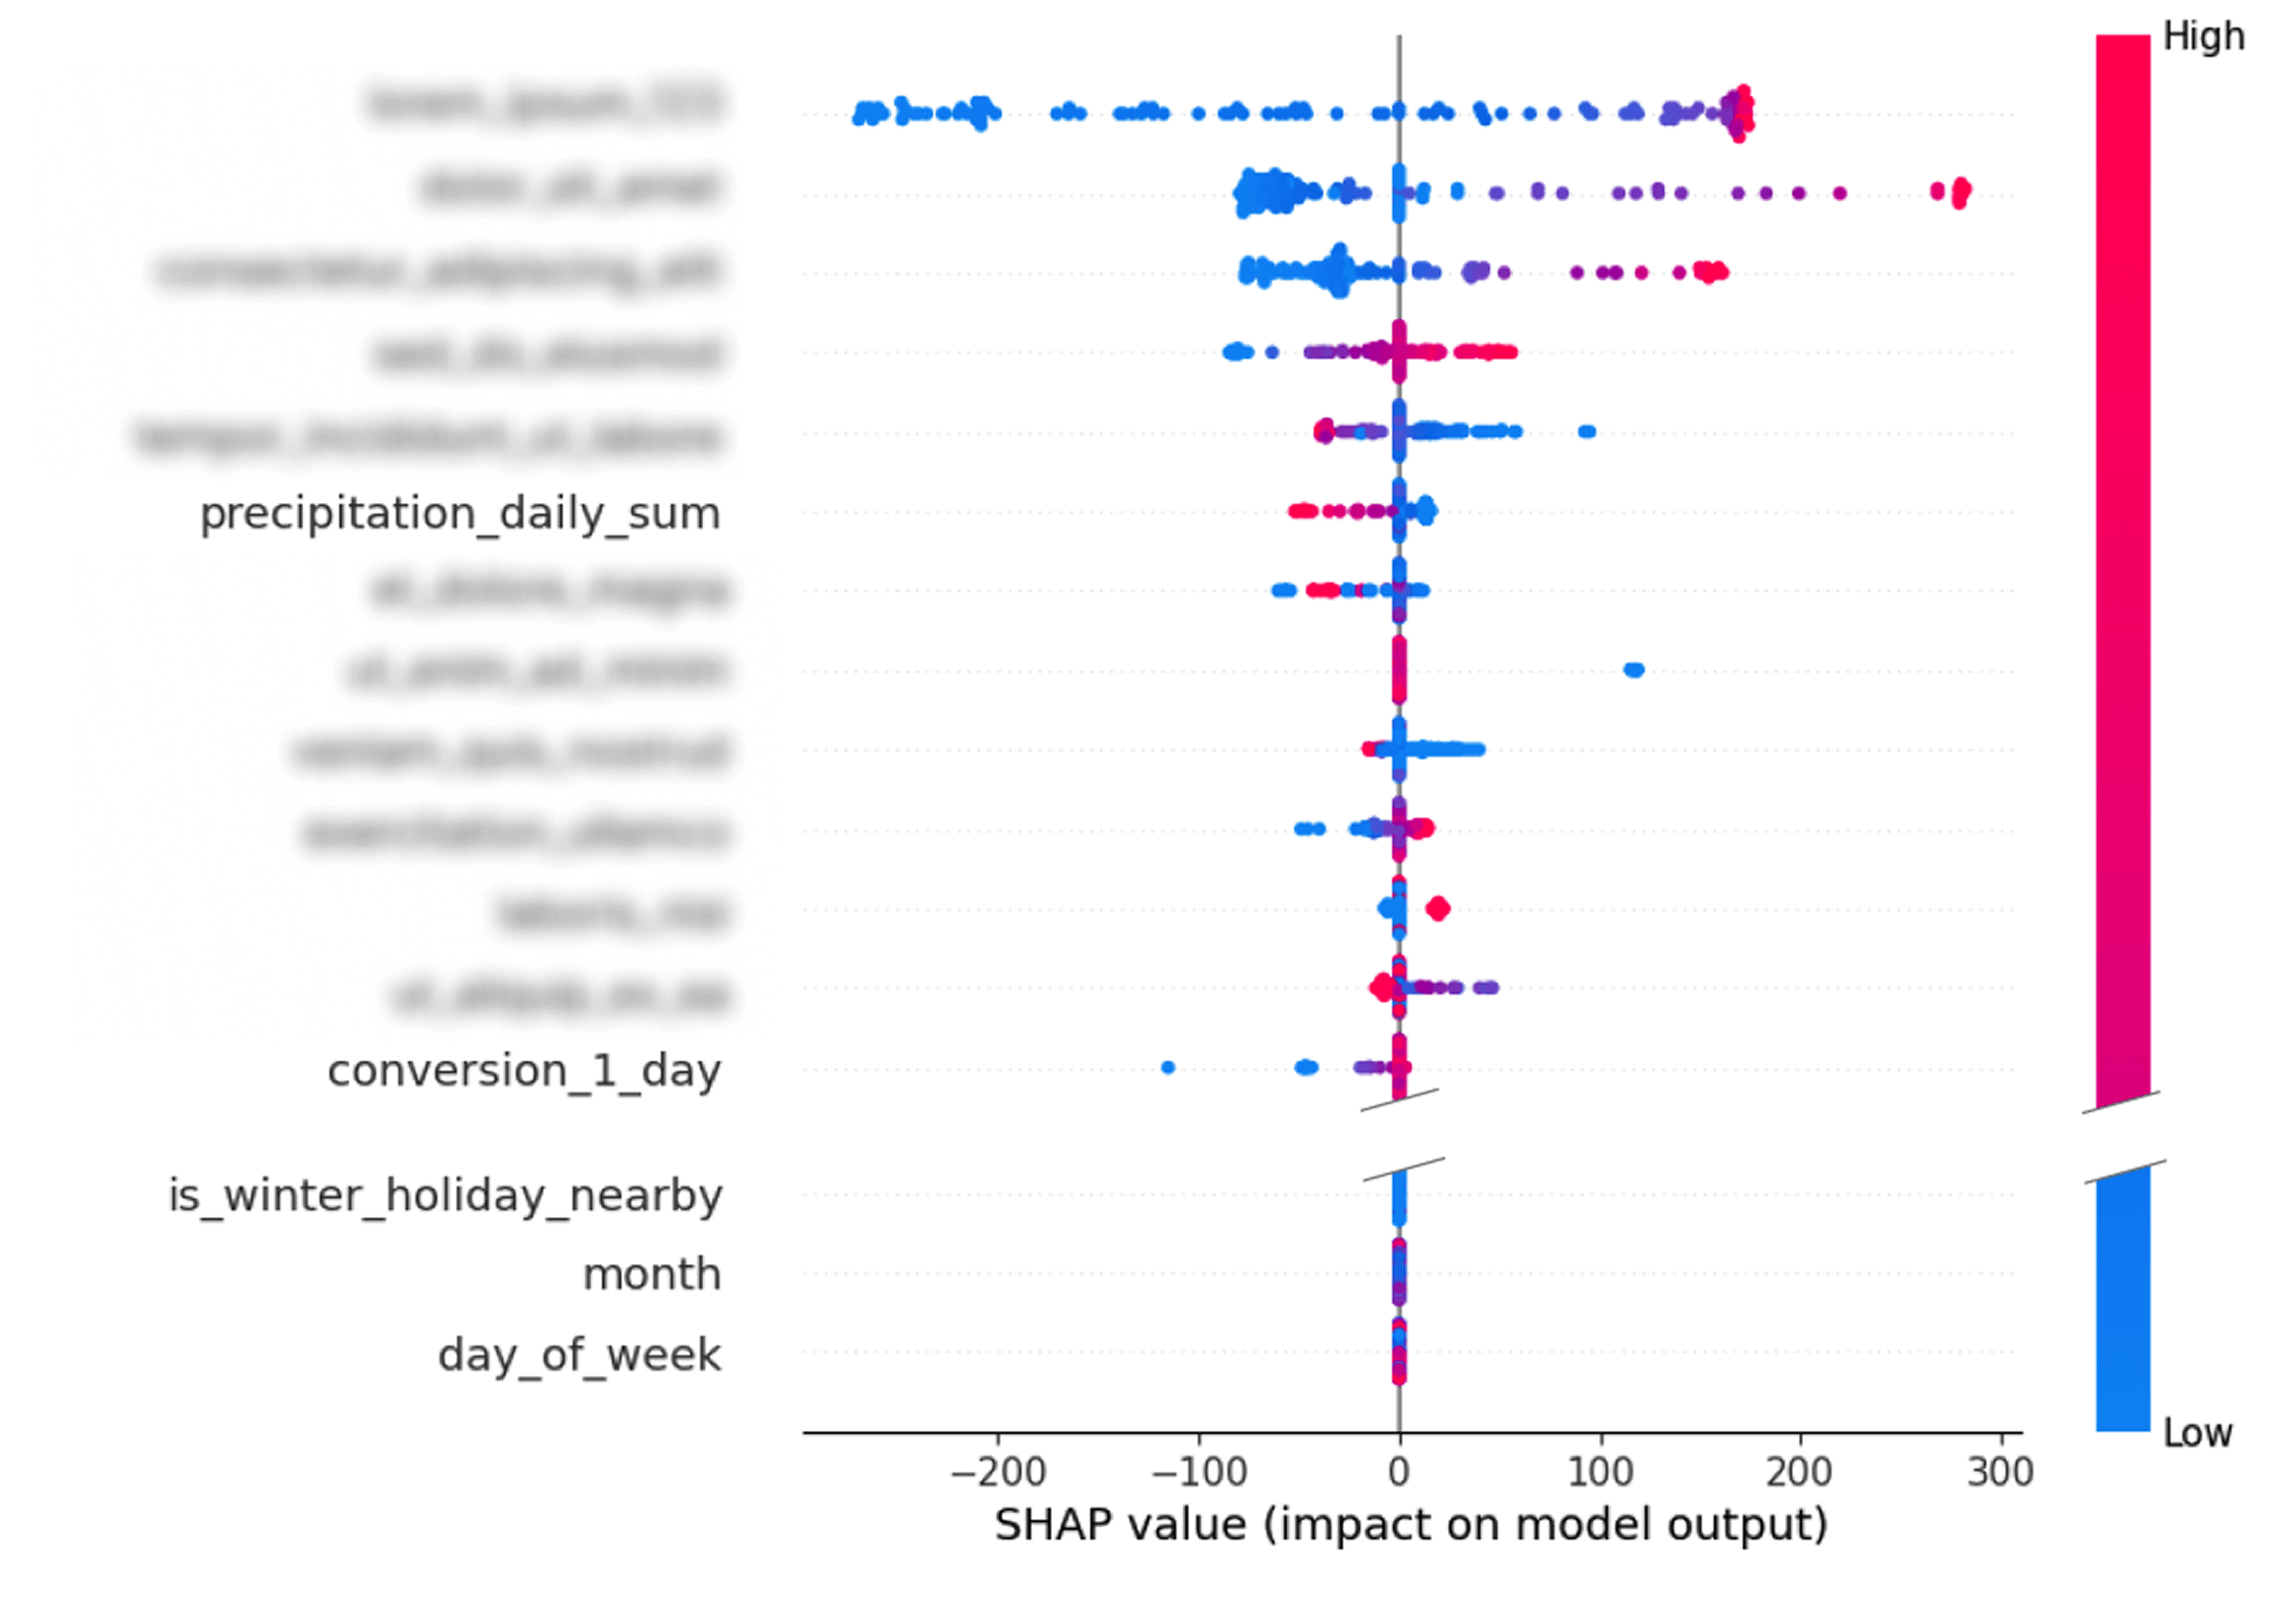
“Pearson's coefficient tells us about a linear correlation, the hypothetical course of which has been plotted on the graph with a black line. This does not mean that the actual behavior of customers is linear. By studying this method, we bypass other types of correlations and dependencies. Such a distribution of points means that the Pearson coefficient indicates a weak relationship. We are dealing with a random distribution with a slight bias towards decreasing values. This feature can serve as additional information to fine-tune the predictive model, whereas on its own without the context of other features it would not provide any opportunities to draw conclusions.
- indicates Michał Pilat, Data Scientist at Droplabs.
Such examples can be multiplied by analyzing data in terms of selected characteristics, e.g. presence of snow cover, cloud cover, but also taking into account data only for selected periods, e.g. holidays, holidays of specific voivodships, days off from work.
“Humans have an innate tendency to memorize characteristic events and to give them greater significance than would be inferred from statistics. In contrast to human perception, the machine learning (AI) based systems used by Droplabs and used in Tatra National Park enable the analysis of real, extensive data sets in multidimensional contexts. This makes it possible to identify subtle dependencies and patterns because they go beyond schematic thinking and intuitive simplifications.”
- adds Monika Karpierz-Nałęcz, Head of AI at Droplabs
To solve the challenge of predicting attendance, Tatra National Park uses the AI-based Attendance Forecast provided by Droplabs. In the web panel there is a preview of the expected attendance for a given day in the future - the “from to” ranges are visible. A preview is also available to help understand the effectiveness of the forecast - for dates in the past you can check what the historical forecast was and what the actual values were obtained - this helps to build confidence in the models.
Like standard weather forecasts, Droplabs attendance predictions for future days are not static — they change over time. The rule applies here: the closer to the deadline, the more effective the prediction is. This is due to the fact that the time horizon is getting shorter and models have more data of better quality, such as fresh, more accurate weather forecasts or more signals about customer behavior in the online store.
“Longer predictive horizons are inherently more difficult to estimate because the model has to process and verify the entire dynamically changing context of the data. For example, the same booking level can mean something different depending on the weather forecast — suggesting a planned or spontaneous visit. When the weather forecast changes, the entire decision-making context changes. The model needs to match the prediction to the current market situation and external conditions, rather than relying on data and assumptions from a few days ago.”
- points out Piotr Pyznarski, founder of Droplabs responsible for product and technology (CTO)
Droplabs predictive models are characterized by high efficiency. In the Tatra National Park, accurately determining the range of attendance for the coming day in about 90% of cases.

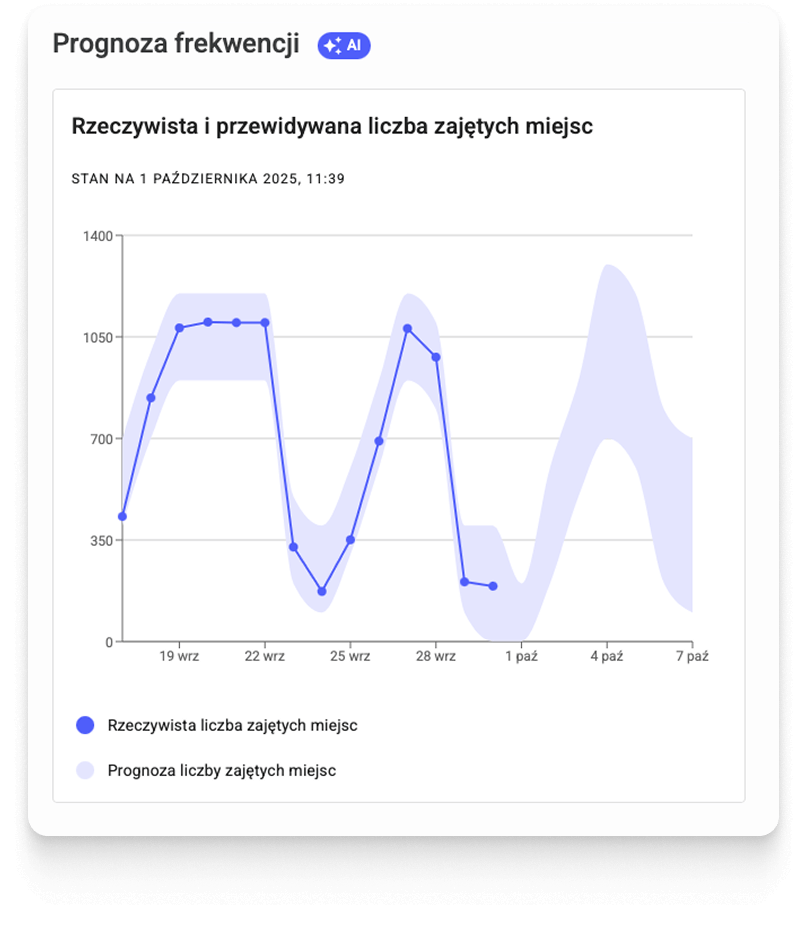
For illustration, let's look at the screenshot of the forecast history for the second half of September 2025 seen above. For example, for Friday, September 19, 2025, as well as for the entire weekend following it and the working Monday, September 22, full occupancy of the parking lot was foreseen - which fully worked out.
More importantly, the system successfully captures subtle changes in demand. The model correctly predicted a significant drop in attendance on the following Thursday, September 25, compared to the Thursday of the previous week. Actual data confirmed this trend: on September 25, only 350 cars were recorded, while Thursday the week before attracted more than 800 vehicles.
An analysis of the data from October 9, 2025 illustrates the independence of demand from the weather forecast itself. On Thursday, October 9, in a rainy and cool atmosphere, 217 cars appeared in the parking lot. Despite the essentially identical atmospheric circumstances predicted for the following Friday, the attendance model pointed to a much higher range of predictions. Real data confirmed this prediction: attendance on Friday was more than double, reaching 450 vehicles.
The TPN car park on the Morskie Oko trail is a complex infrastructure, consisting of three separate parking zones: the main parking lot on Palenica Białczańska (with a capacity of about 600 vehicles), the road lane between Palenica Białczańska and Łysa Polana and a paved parking lot on Łysa Polana.
Accurate attendance forecasts are important for the operational preparation of TPN. They enable efficient planning of Park Service patrols, optimal crew placement in parking lots and ongoing adaptation of communications to tourists. As a result, more efficient management of operations leads to optimization of the running costs of the Park.
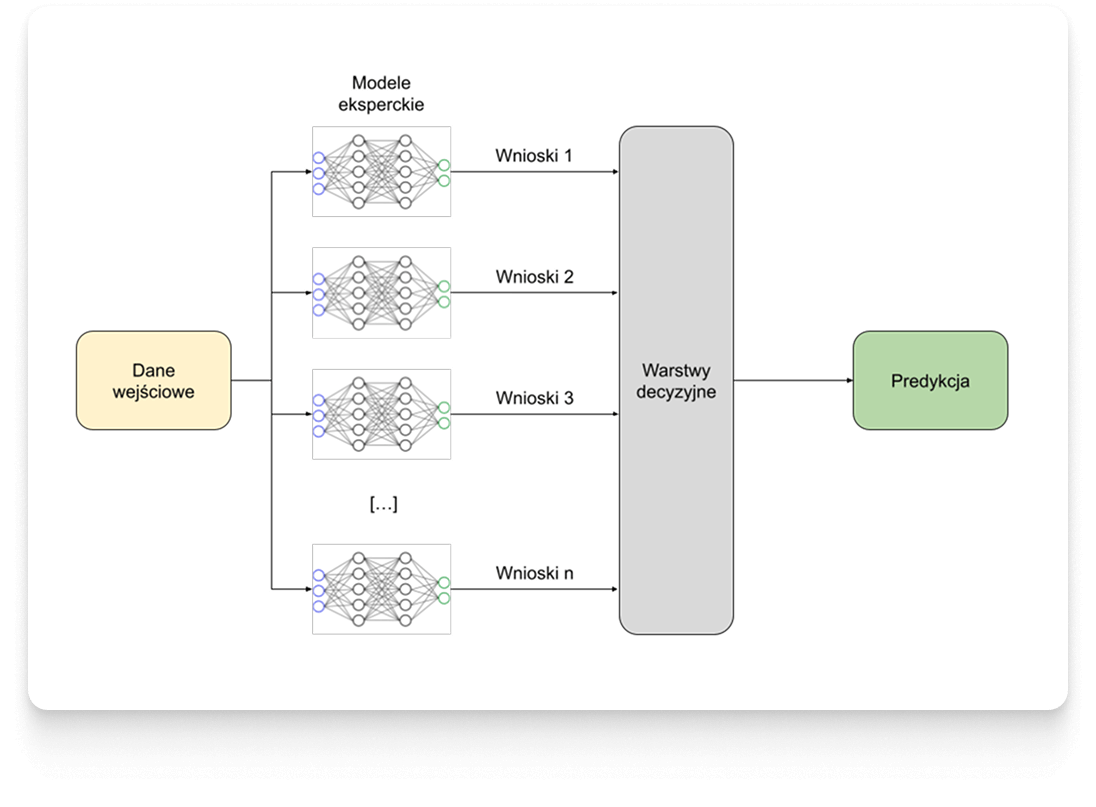
In the next article, we delve into the technological side of solutions and see an insight into AI systems from Droplabs. We invite you to read it below links.
This post is part of a larger article.”AI at the service of heritage: Dynamic Pricing Droplabs and attendance prediction in shaping sustainable tourism behaviour in TPN.”
.png)