Technology side of solutions - Insight into AI systems from Droplabs
This post is part of a larger article.”AI at the service of heritage: Dynamic Pricing Droplabs and attendance prediction in shaping sustainable tourism behaviour in TPN“. Part one describes the business aspect of forecasting attendance - we invite you to her reading!
TPN uses the AI-based Attendance Forecasting engine provided by Droplabs as part of the online sales system with Dynamic Pricing. The forecasting of attendance is important for the management efficiency of TPN, it helps in planning the work schedule of the Park Service (patrols) and the optimal deployment and preparation of personnel in individual parking lots. In addition, it helps TPN to customize information messages for visitors on an ongoing basis.
As outlined in the first part, the TPN parking complex, which is the gateway to the Sea Eye, is a multi-element infrastructure. It includes the main car park on Palenica Białczańska (with a capacity of about 600 seats), as well as a complementary road lane connecting Palenica Białczańska with Łysa Polana and a paved parking lot in Łysa Polana.
Insight into Technological Mechanisms
It is worth clearly noting that the AI mechanism created by Droplabs is based on machine learning models, that is, the foundation of artificial intelligence. Does not use on the other hand, the mechanisms most commonly associated with AI today, such as large language models (LLM) known from chatbots (e.g. Gemini or ChatGPT).
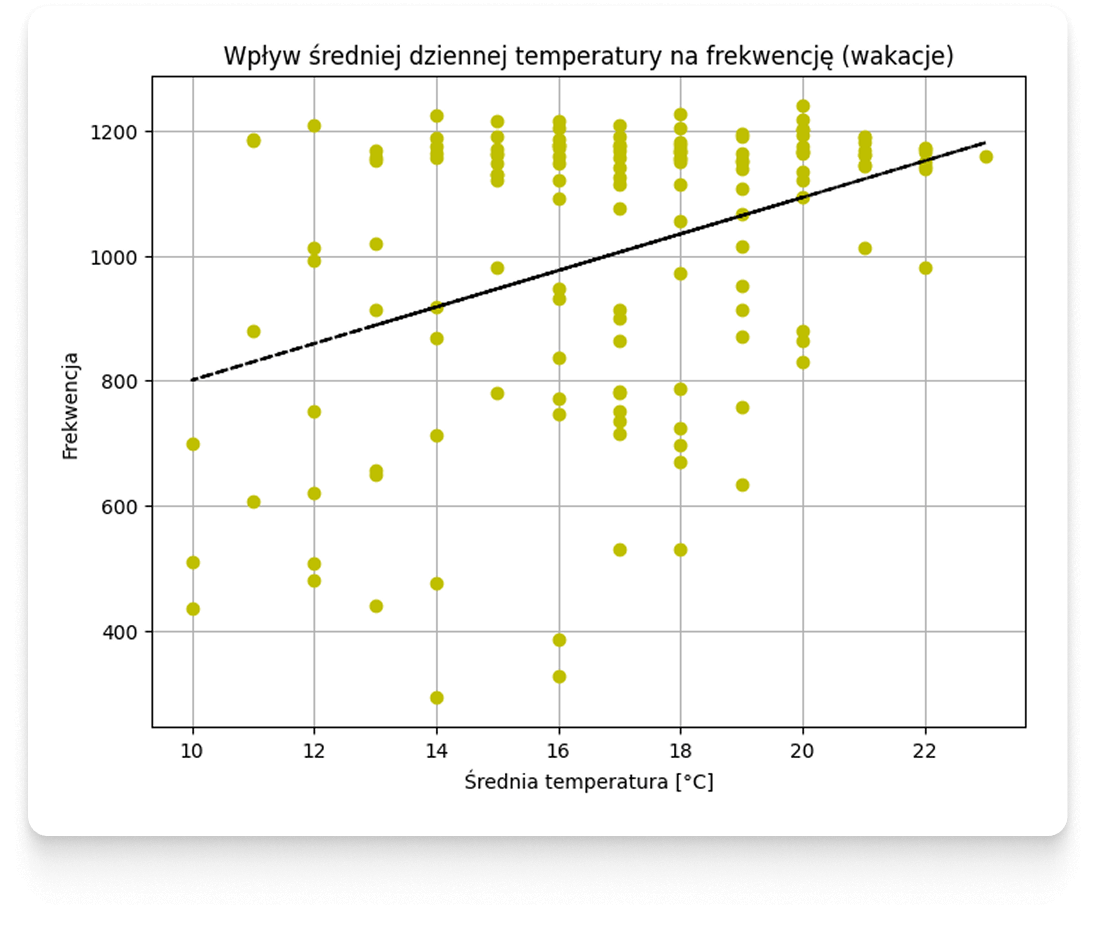
If we want to look under the mask of applied solutions, let's start with the stage that begins work on the machine learning model or the so-called data mining. Among other things, the scatter plots already mentioned in the first part are useful for this.
Scatter plots allow us to refute the hypothesis of simple relationships between weather and attendance.
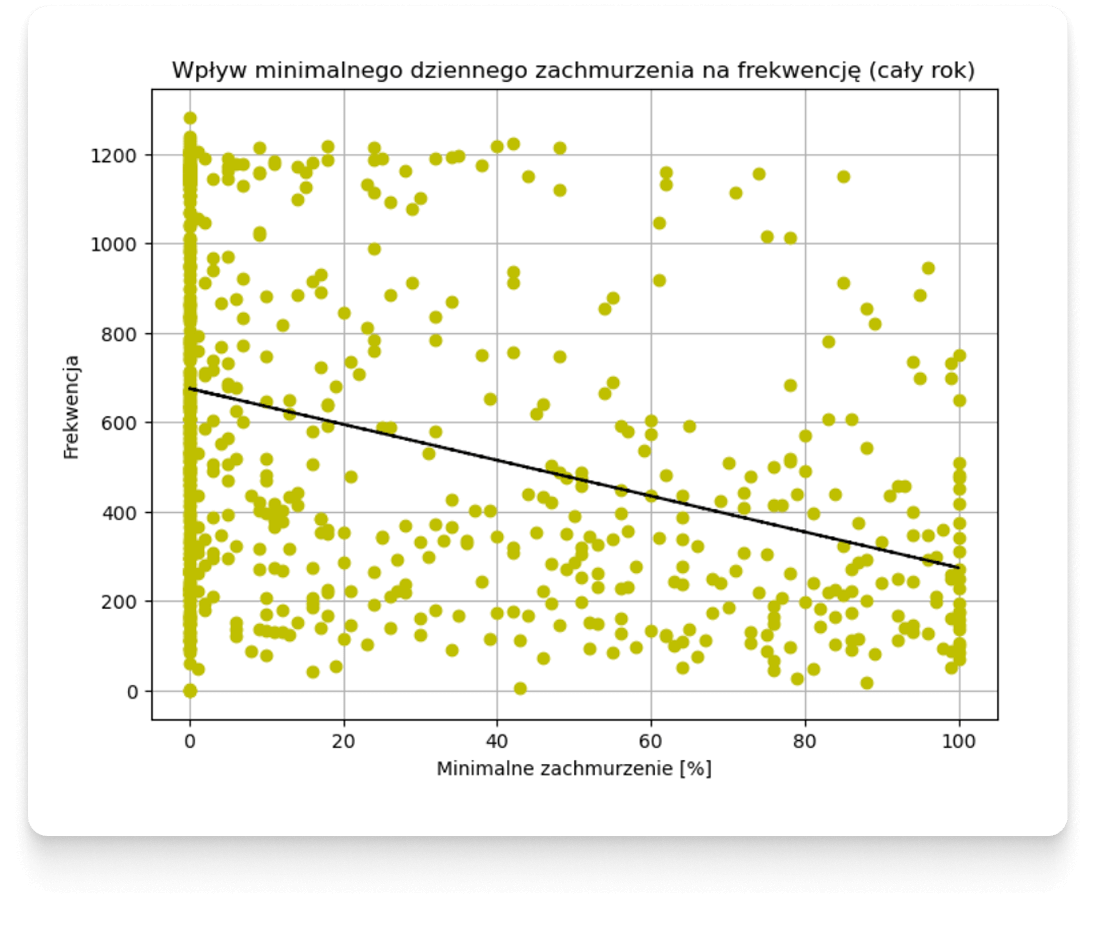
Below we will present additional examples illustrating attendance at Morskie Oko Car Park in relation to isolated individual weather features. In the graphs, hypothetical linear waveforms have been plotted with a black line, the correlation of which is determined by the Pearson coefficient - plotting them, of course, does not mean that the actual behavior of customers is linear - in conducting such an analysis, in this case, we bypass other types of correlations and dependencies that are analyzed by other methods in the following steps. It should also be borne in mind that these are only selected visualizations — the entire analysis process takes into account features from many different data sources, not just weather forecasts.

Just as scatter plots allow to refute hypotheses about simple relationships between weather and attendance, but help to get acquainted with the characteristics of the data, so another method used in the initial phases of work on predictive models, i.e. cluster analysis - allows you to catch different customer behaviors, some unobvious relationships and similarities between terms, and find unusual data points.

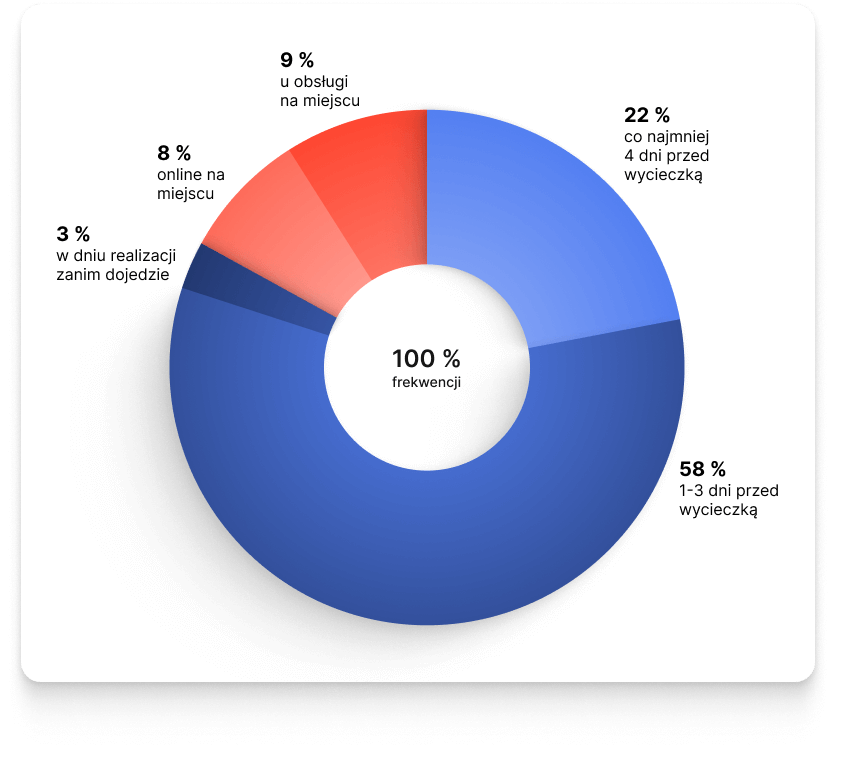
“The groups 1 and 3 shown in the graph - they are responsible for planned and unplanned trips in the summer season, respectively - are the days characterized by the highest annual attendance. However, their purchasing mechanisms differ significantly: in the group of scheduled days, about 80% of tickets are purchased at least one day in advance. For unplanned days, this value falls below 60%.
The analysis shows that this discrepancy is mainly shaped by meteorological conditions. Clients tend to schedule visits on days with an anticipated favorable aura. Intriguingly, on days with a less favorable forecast, attendance is not significantly reduced, but the behavior of customers changes crucially, who become more spontaneous in responding to current conditions (e.g. when the expected rain turns out to be only a morning drizzle).”
- adds Michał Piłat Data Scientist from Droplabs
Model Architecture and Coaching
With knowledge of data characteristics, it is possible to proceed to the stage of choosing the model and the optimal architecture to solve the problem within a specific time horizon. At this stage - many different machine learning models and data configurations are tested for each prediction horizon. The effectiveness of the model is evaluated using the so-called Confusion Matrix.
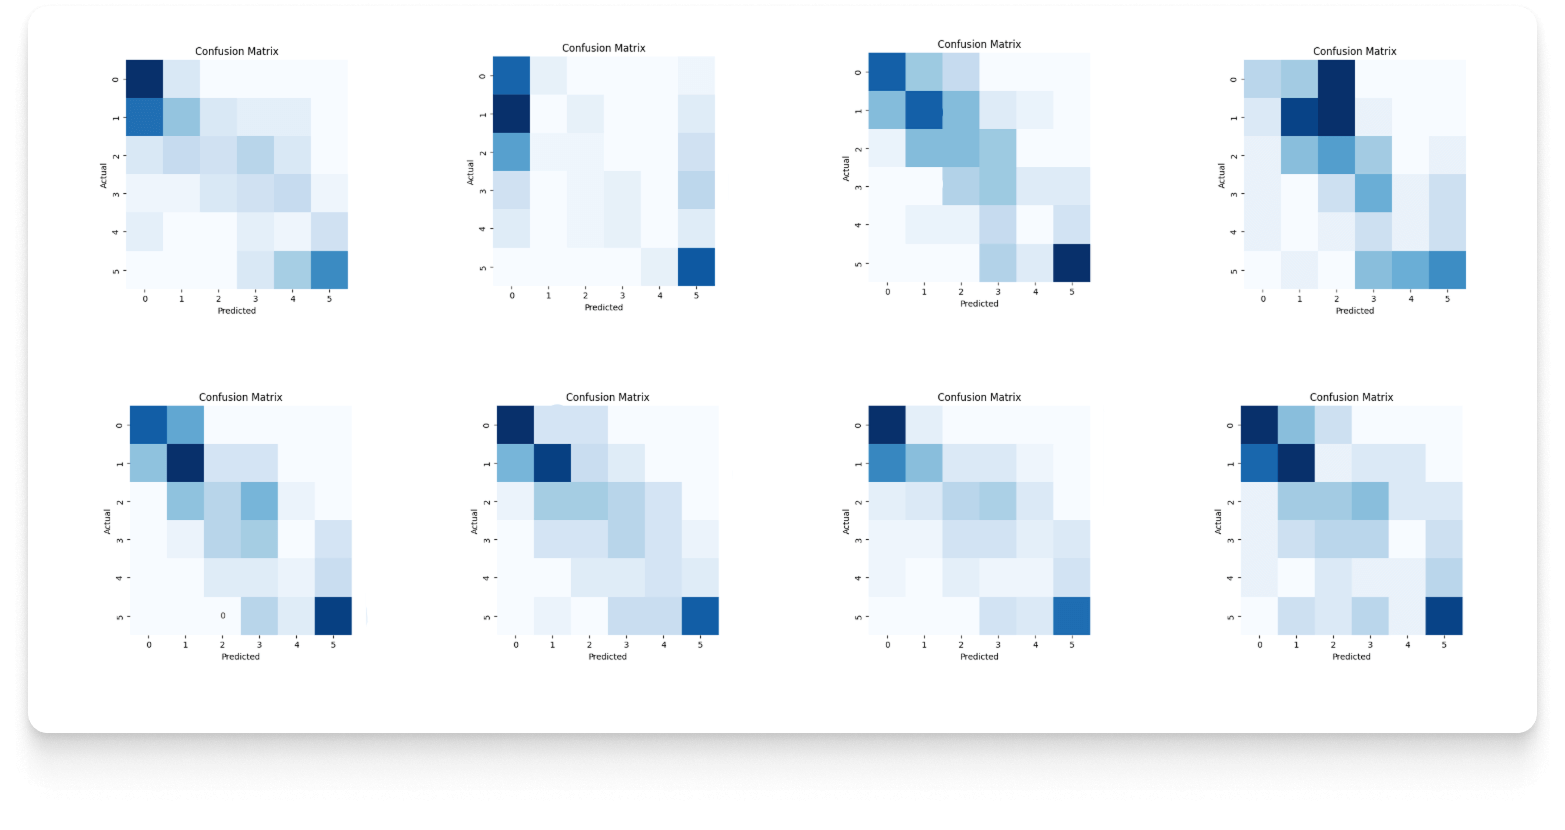
Through an analysis of effectiveness, the final solution was chosen architecture from the category of deep neural networks (deep neural networks).
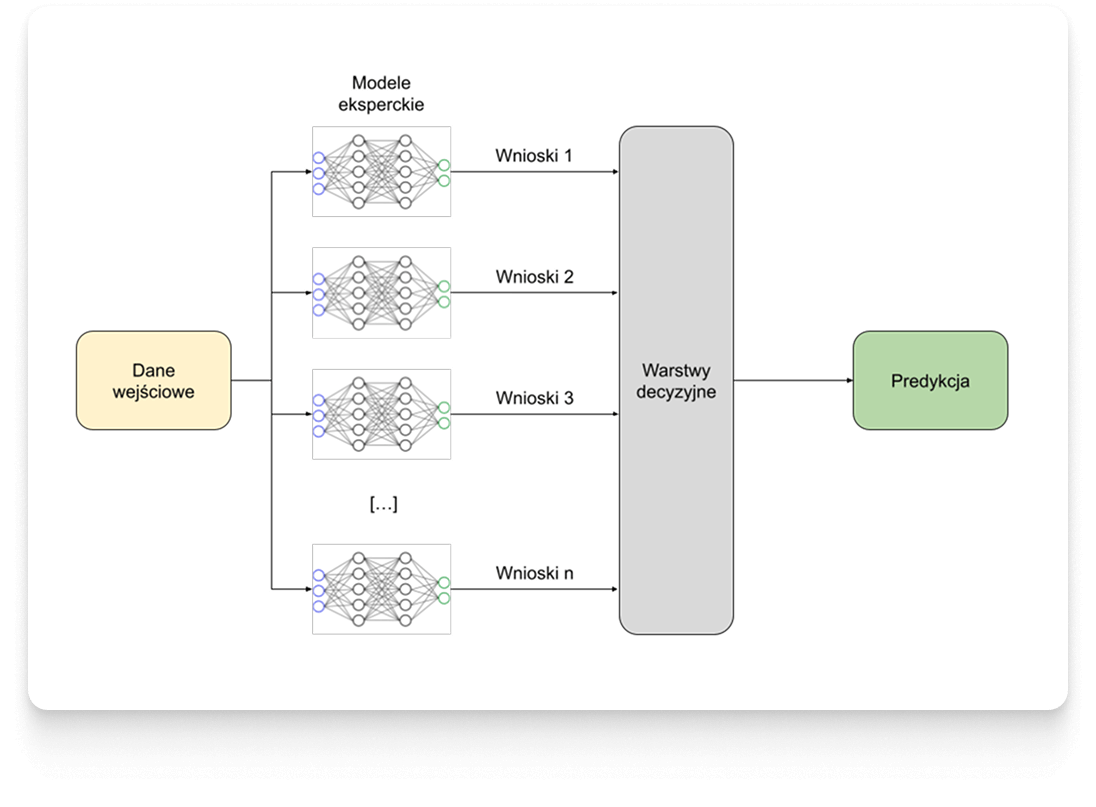
Deep learning models are not a standard approach for the type of data on which to work. The research and optimization of the process led by the Droplabs team, led to the selection a custom architecture combining the features of deep learning and ensemble learning, that is, an intelligent combination of many modules. Droplabs thus obtains a “team of experts” in which each model specializes in a different field and the final decision is made on the basis of the conclusions drawn by all the individual components.
Such an architecture gives Droplabs a universal solution that can be adapted to the individual needs of a given object resulting from previous data mining.
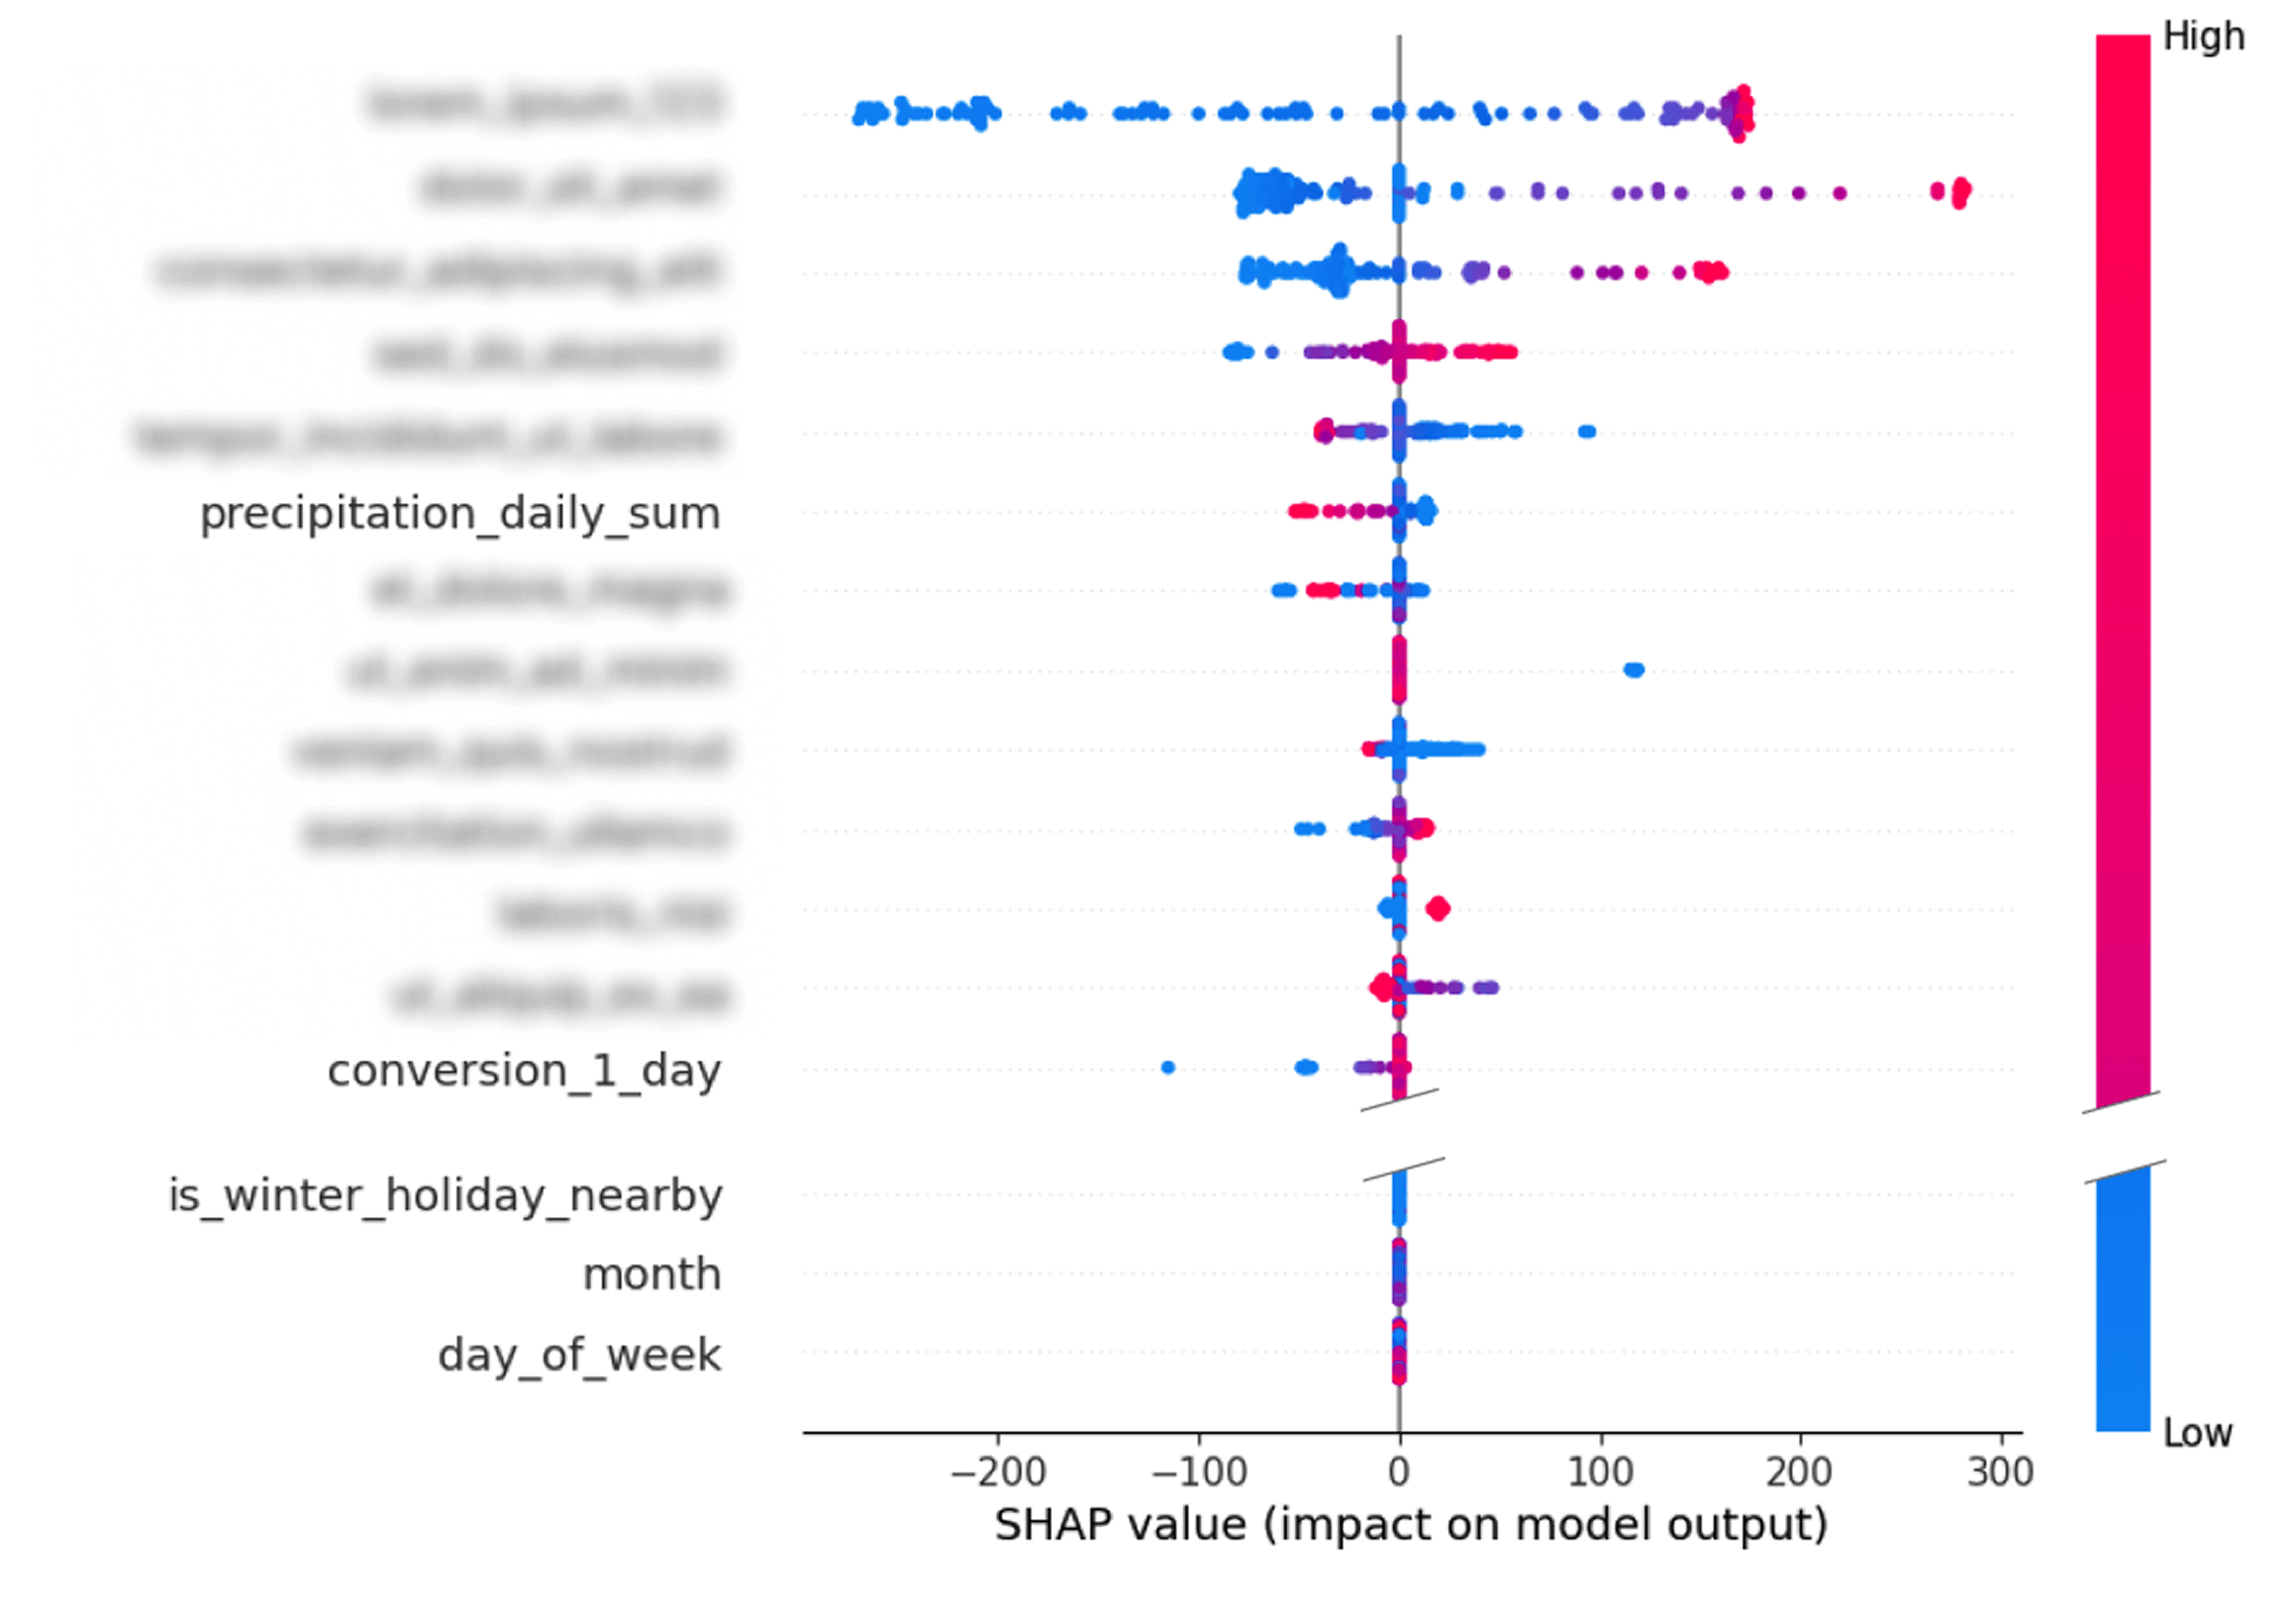
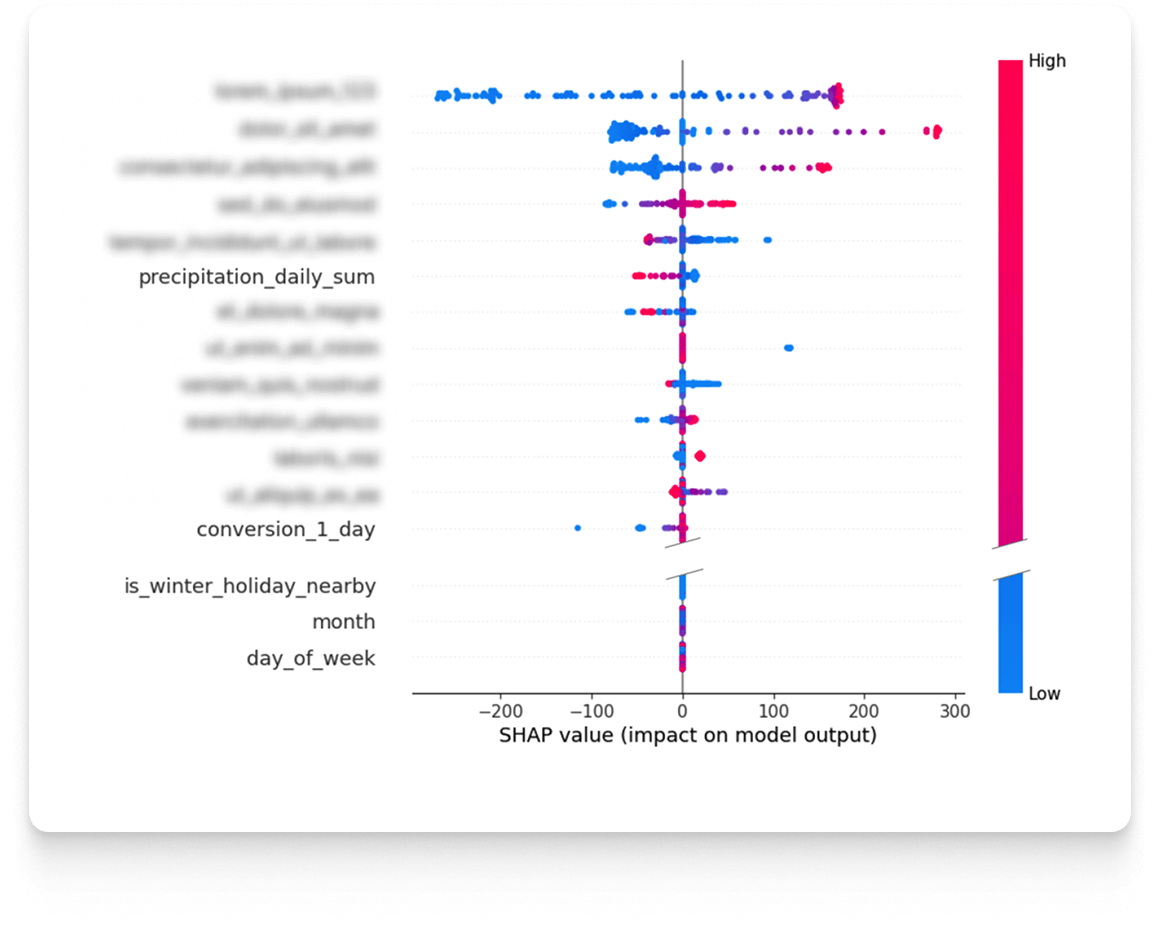
After choosing the architecture of the model, the next important stage begins, which is its training. It is important to understand that predicting attendance for the coming day is an analytical problem different from creating a forecast for the horizon 3 or 7 days ahead. In different situations, we have different sets of available data that are crucial. That is why each prediction horizon is treated as a separate model, which must be independently optimized. The first task is to determine the optimal parameters and select the characteristics. For this, Droplabs conducts a detailed sensitivity analysis. This analysis makes it possible to determine precisely to what extent individual characteristics influence the final result of the prediction. This study can be performed both for specific cases and for the entire data set. The result is a list of features sorted by the strength of their influence on the prediction result, which allows optimal tuning of each model.
A critical step is also the selection and calibration of so-called hyperparameters. These are the structural parameters of the model, which are established before the start of training and which do not change during it, but fundamentally affect its performance. These include settings closely related to the architecture of the model, such as the number of neural network blocks or the size of the input layer. To achieve maximum efficiency for a specific prediction horizon, hundreds of experiments are carried out. This iterative optimization process aims to determine the configuration that will maximize the performance of the model.
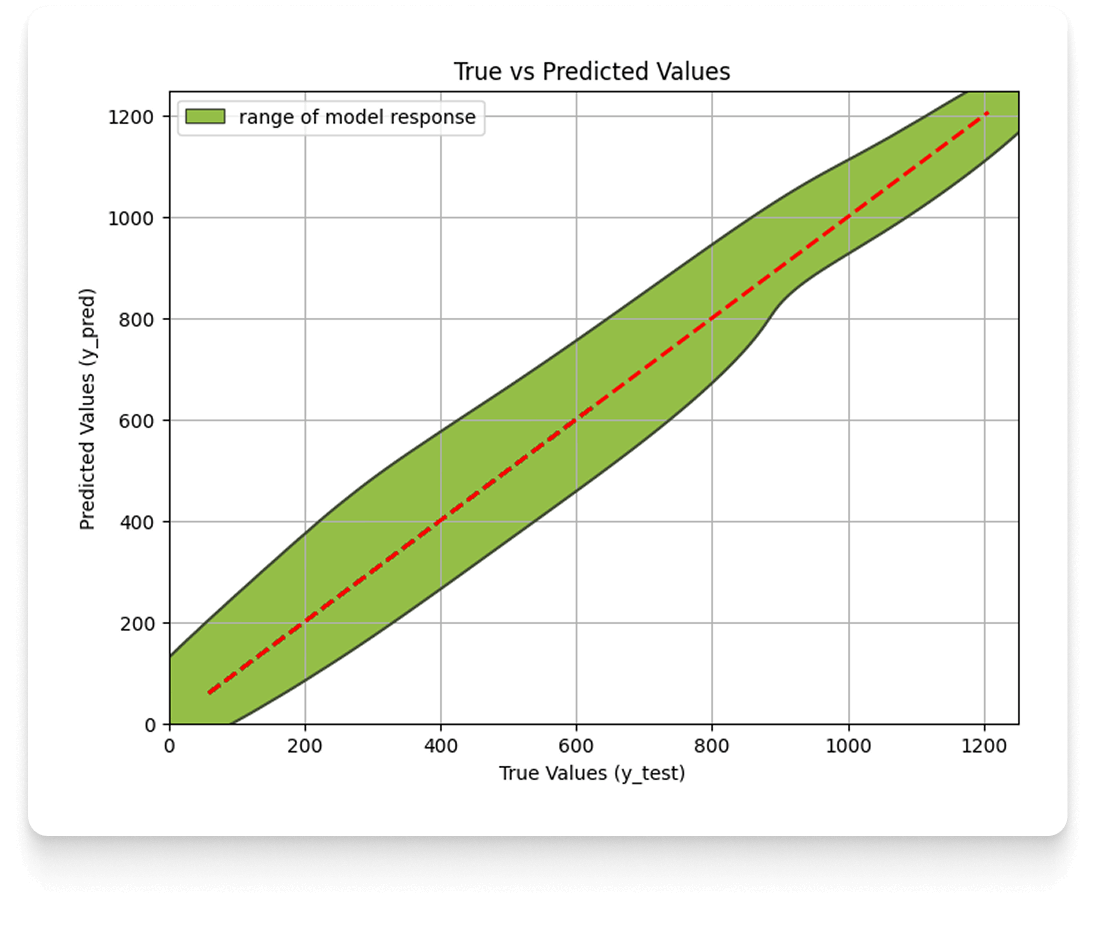
Once the hyperparameters have been selected and the model has been trained, the necessary stage is its validation, that is, verification that it reaches the expected level of precision and accuracy. This process is visualized using a graph of actual vs. predicted values.
Monitoring and Maintenance (Machine Learning Engineering)
It may seem that the work is coming to an end on this, but it is basically the beginning of an endless cycle that is designed to deliver high-quality predictions every daya. After training the model, we proceed to the automation process, which includes the steps of validation, versioning and implementation of the model into the production environment, i.e. where the solution will be available to customers. The model is packaged in a service (such as REST API), which allows it to communicate with other elements of the Droplabs system, such as the sales system. This process is responsible for automatically running predictions, saving logs, and monitoring the quality of model performance. As one of the final results, the client receives attendance predictions visible as a visualization on a readable web panel.
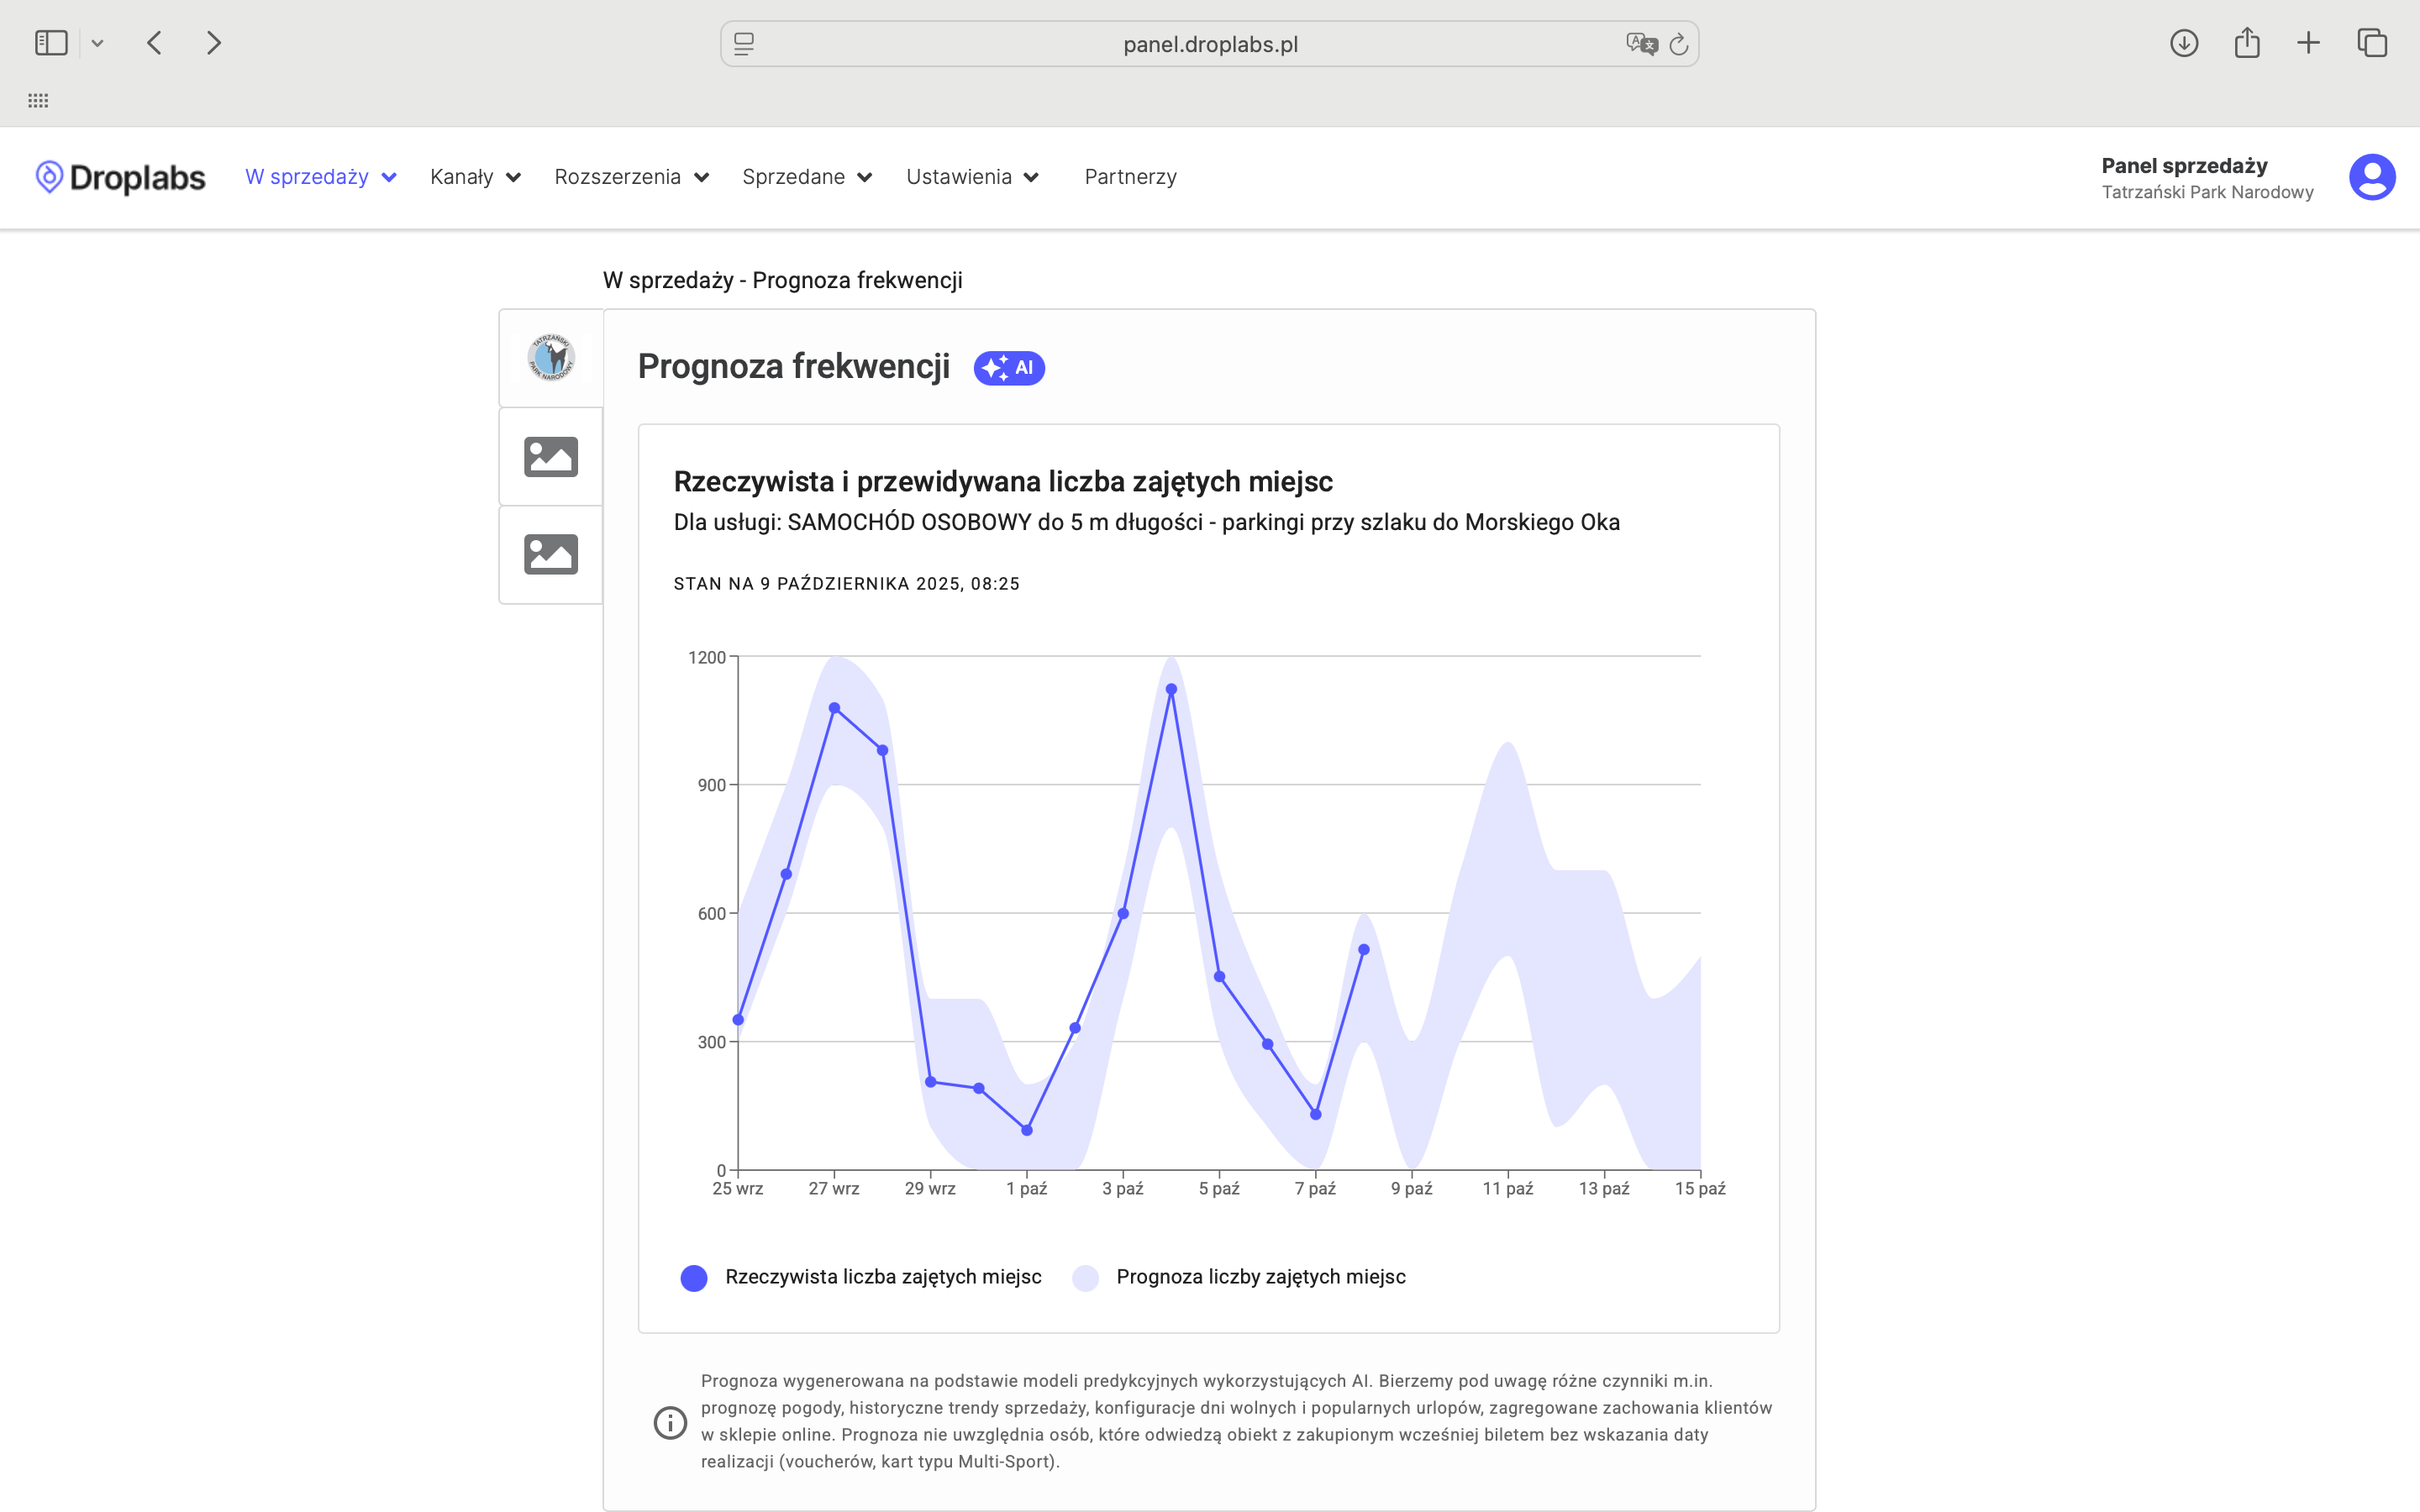
The panel shows the predicted attendance ranges (purple zone) and the actual number of visitors (blue dots) for past dates. This allows TPN to verify the historical accuracy of the system.
After implementation, there is a continuous monitoring and maintenance phase. This includes technical monitoring (server performance) and monitoring the quality of predictions. It is essential to track the drift of data (data drifting) to drift model (model drifting).
“Changes such as the modification of the ticket offer, new marketing actions or changes in the preferences of tourists mean that the optimal operation of the model requires its periodic re-training so that the quality is constantly maintained above the satisfactory threshold.”
- adds Piotr Pyznarski, founder of Droplabs responsible for product and technology (CTO)
summary
Effective attendance prediction requires AI engineering tailored to the specifics of the attractions and tourist destinations industry. A breakthrough for this industry is the adoption by Droplabs of an architecture based on deep neural networks, which acts as a team model (learning ensemble).
”This approach enables Droplabs to create solutions that flexibly adapt to specific tourist attractions - including the Tatra National Park. Thanks to in-depth data mining, specific to each of the facilities, we are able to provide effective attendance predictions.”
- notes Monika Karpierz-Nałęcz, Head of AI at Droplabs.
In the Tatra National Park the range of expected attendance for the coming day works in approx. 90% of cases.
The process of creating, monitoring and constantly improving models is complex and requires the use of proprietary solutions. A team of Droplabs specialists from various fields: Data Science, Machine Learning Engineering, DevOps, Data Analytics and Backend Engineering ensures that qualitative predictions appear in the TPN panel every day.
This post is part of a larger article.”AI at the service of heritage: Dynamic Pricing Droplabs and attendance prediction in shaping sustainable tourism behaviour in TPN“. The next part will reveal how Dynamic Pricing Droplabs helps shape visitor behavior.